Email Campaign Experiment Analysis for a Wine Retailer
A wine retailer is running email marketing experiments to evaluate offers before sending the offers to a broader set of customers. In this experiment they were examining the impact of an email that was intended to drive purchases. They want to evaluate whether the promotion is effective and who to target with the email campaign.
Exploratory Data Analysis
The data we have is the experiment data containing customer ID, the control or experimental group each customer belongs to as well as the behavior information. Based on the data, I first explored the dataset and had a general idea about the difference between two groups.
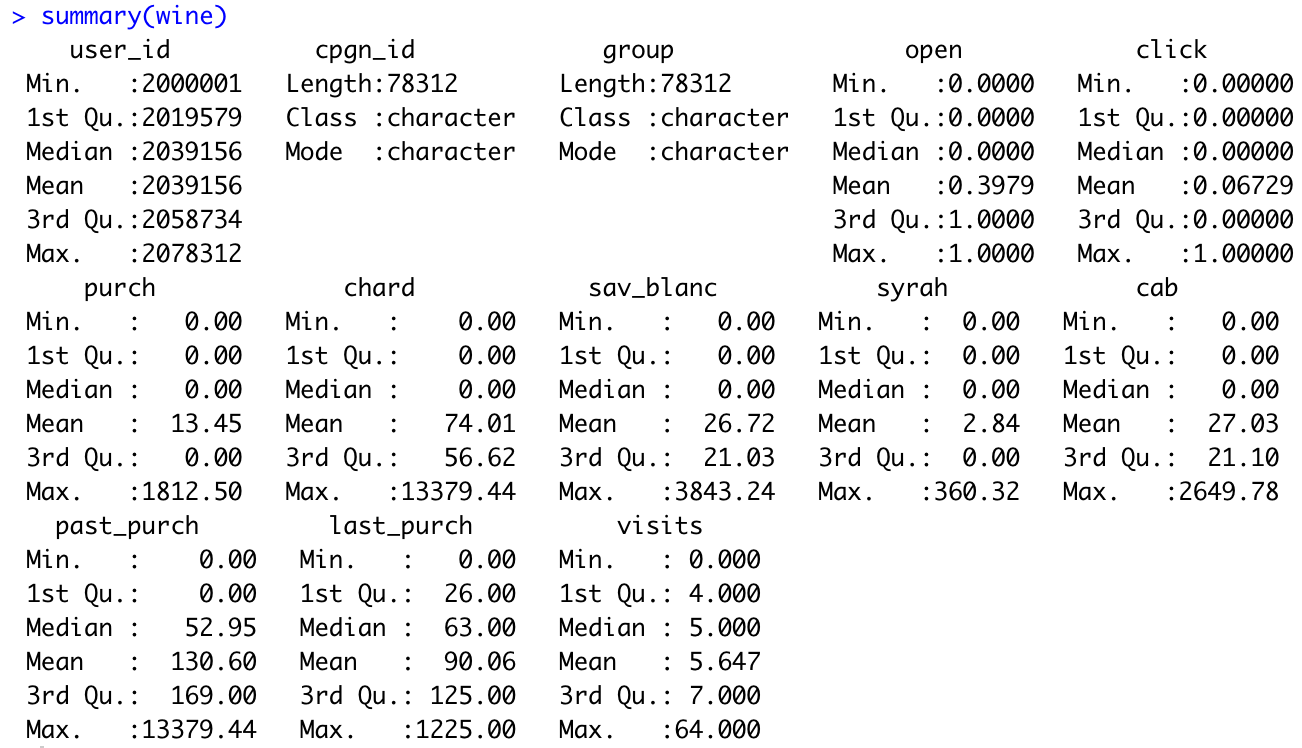
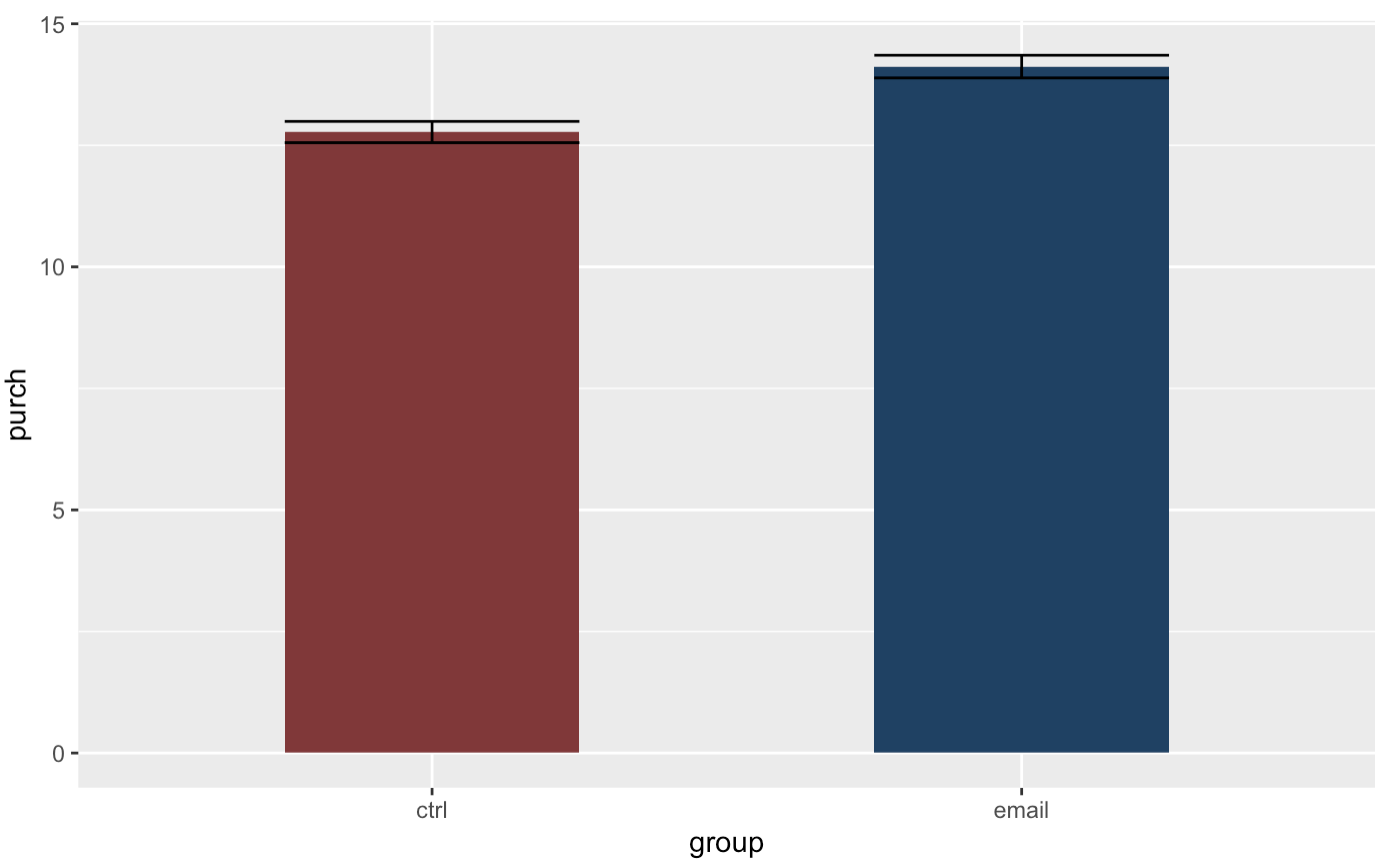
After looking at the average values of opening, clicking the email as well as amount of purchases for different groups, we can find that the customers who received the email seem to have higher amount of purchases.
This result seems quite reasonable. However, we still have many questions to consider: Is the relationship between sending emails and purchasing amount robust? If the answer is yes to the first question, what type of customers should be the target of our email campaign? And considering the cost, who should we send emails to so we can achieve higher profit? To figure out the questions, I divided my analysis into three steps.
Step 1: Verify the Impact of Email Campaign
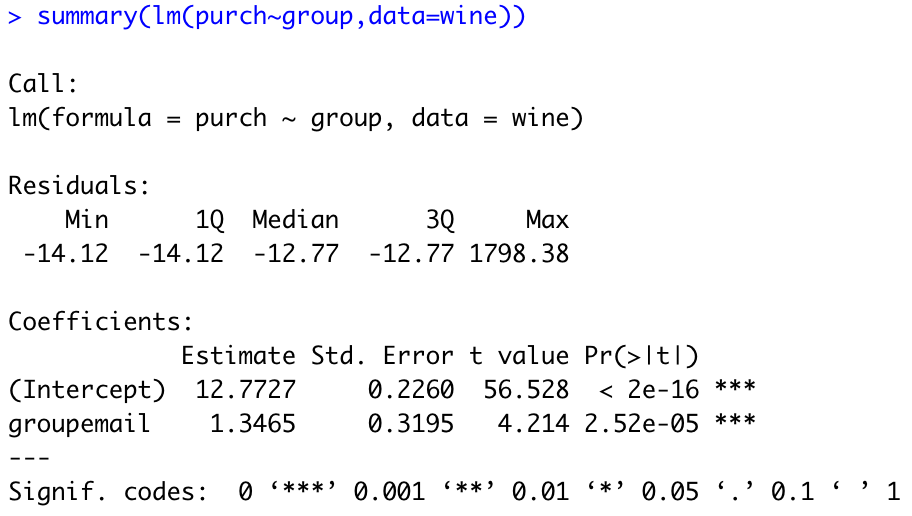
First of all, I would like to verify the impact of sending emails on number of purchases. The average causal effect we got through linear regression showed that the relationship between sending emails and number of purchases is statistically significant. Sending emails will increase purchase by $1.35 under average causal effect.
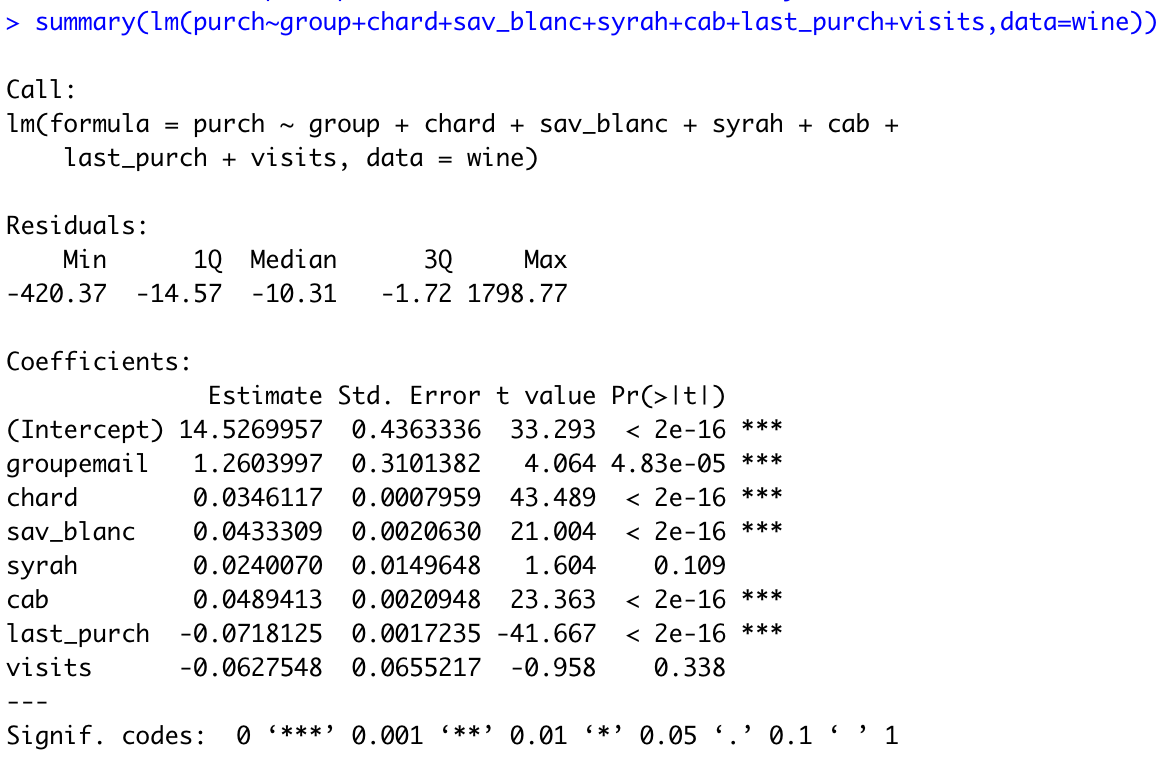
After adding baseline variables, the relationship is still significant. Sending emails can increase purchase by $1.26 under conditional causal effect. (Here we removed the past_purch variable and only kept last_purch because the collinearity between them)
Step 2: Explore the Target Group with High Response Probability
From the regression above, we know that the purchasing amount is also related customers’ behaviors. So next step, I decided to explore the customers with high response probability to increase the success rate of this campaign and conclude their purchasing behaviors.
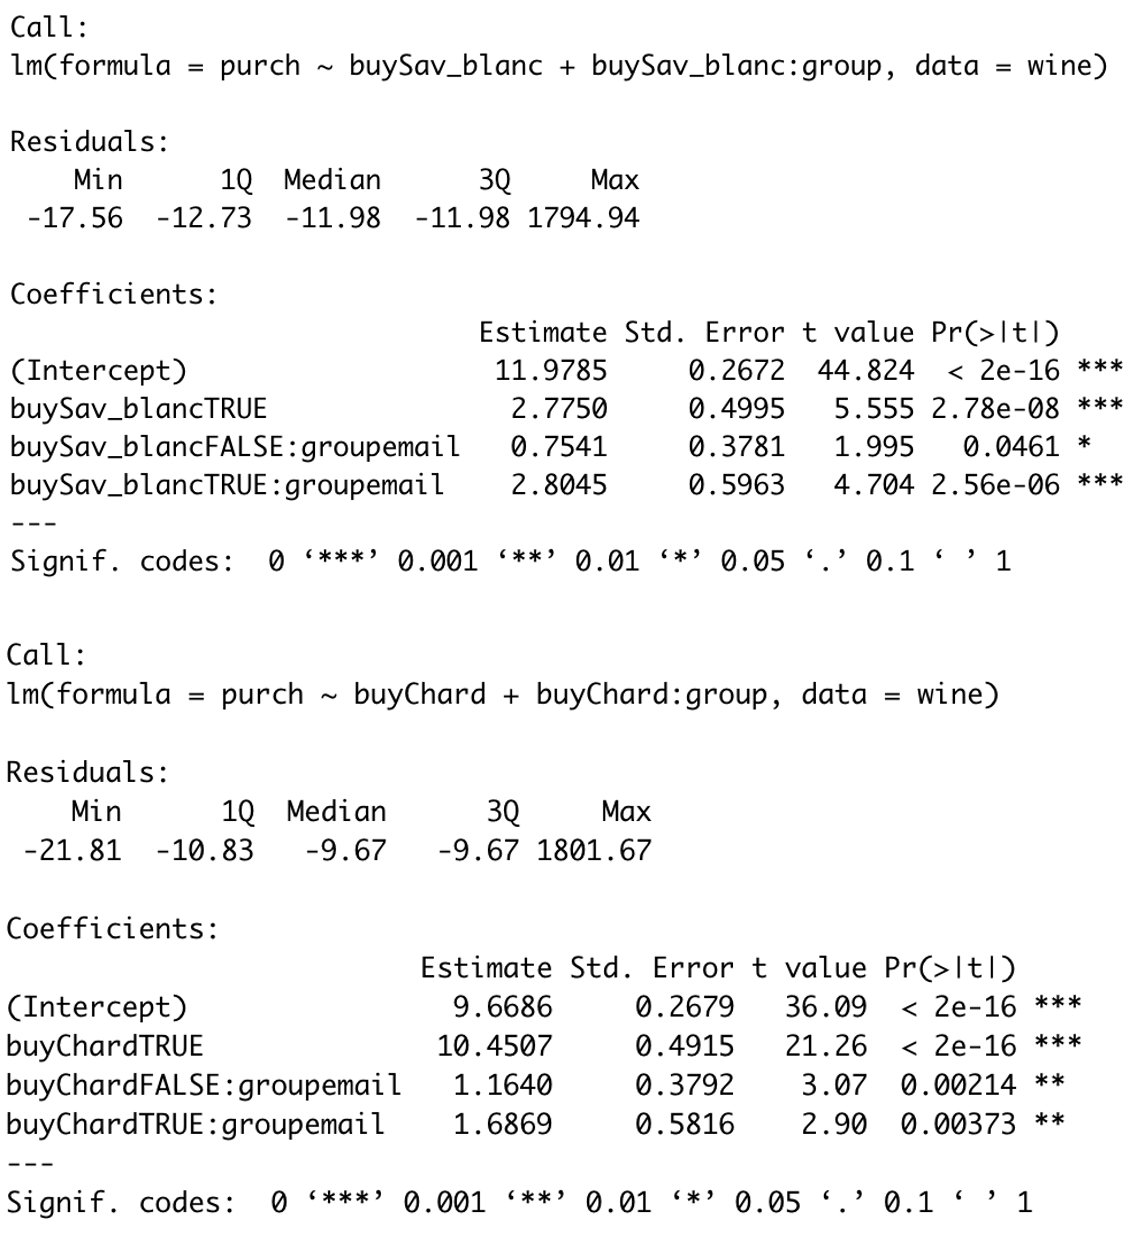
Given that we have the significant variables such as the brand of wines the customer bought and days since their last purchase, I conducted slice and dice analysis to analyze the conditional causal effects among different groups.
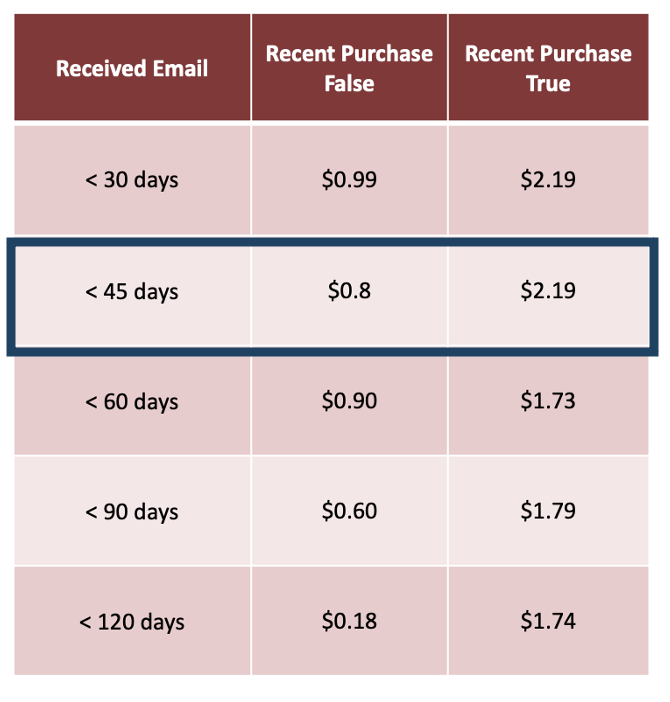
After several trials, I decided to define customers who recently purchased as those who purchased within 45 days since this generated the greatest difference in purchasing amount between two groups. And for those brands, I simply divided customers into different groups based on whether they bought the brands or not.
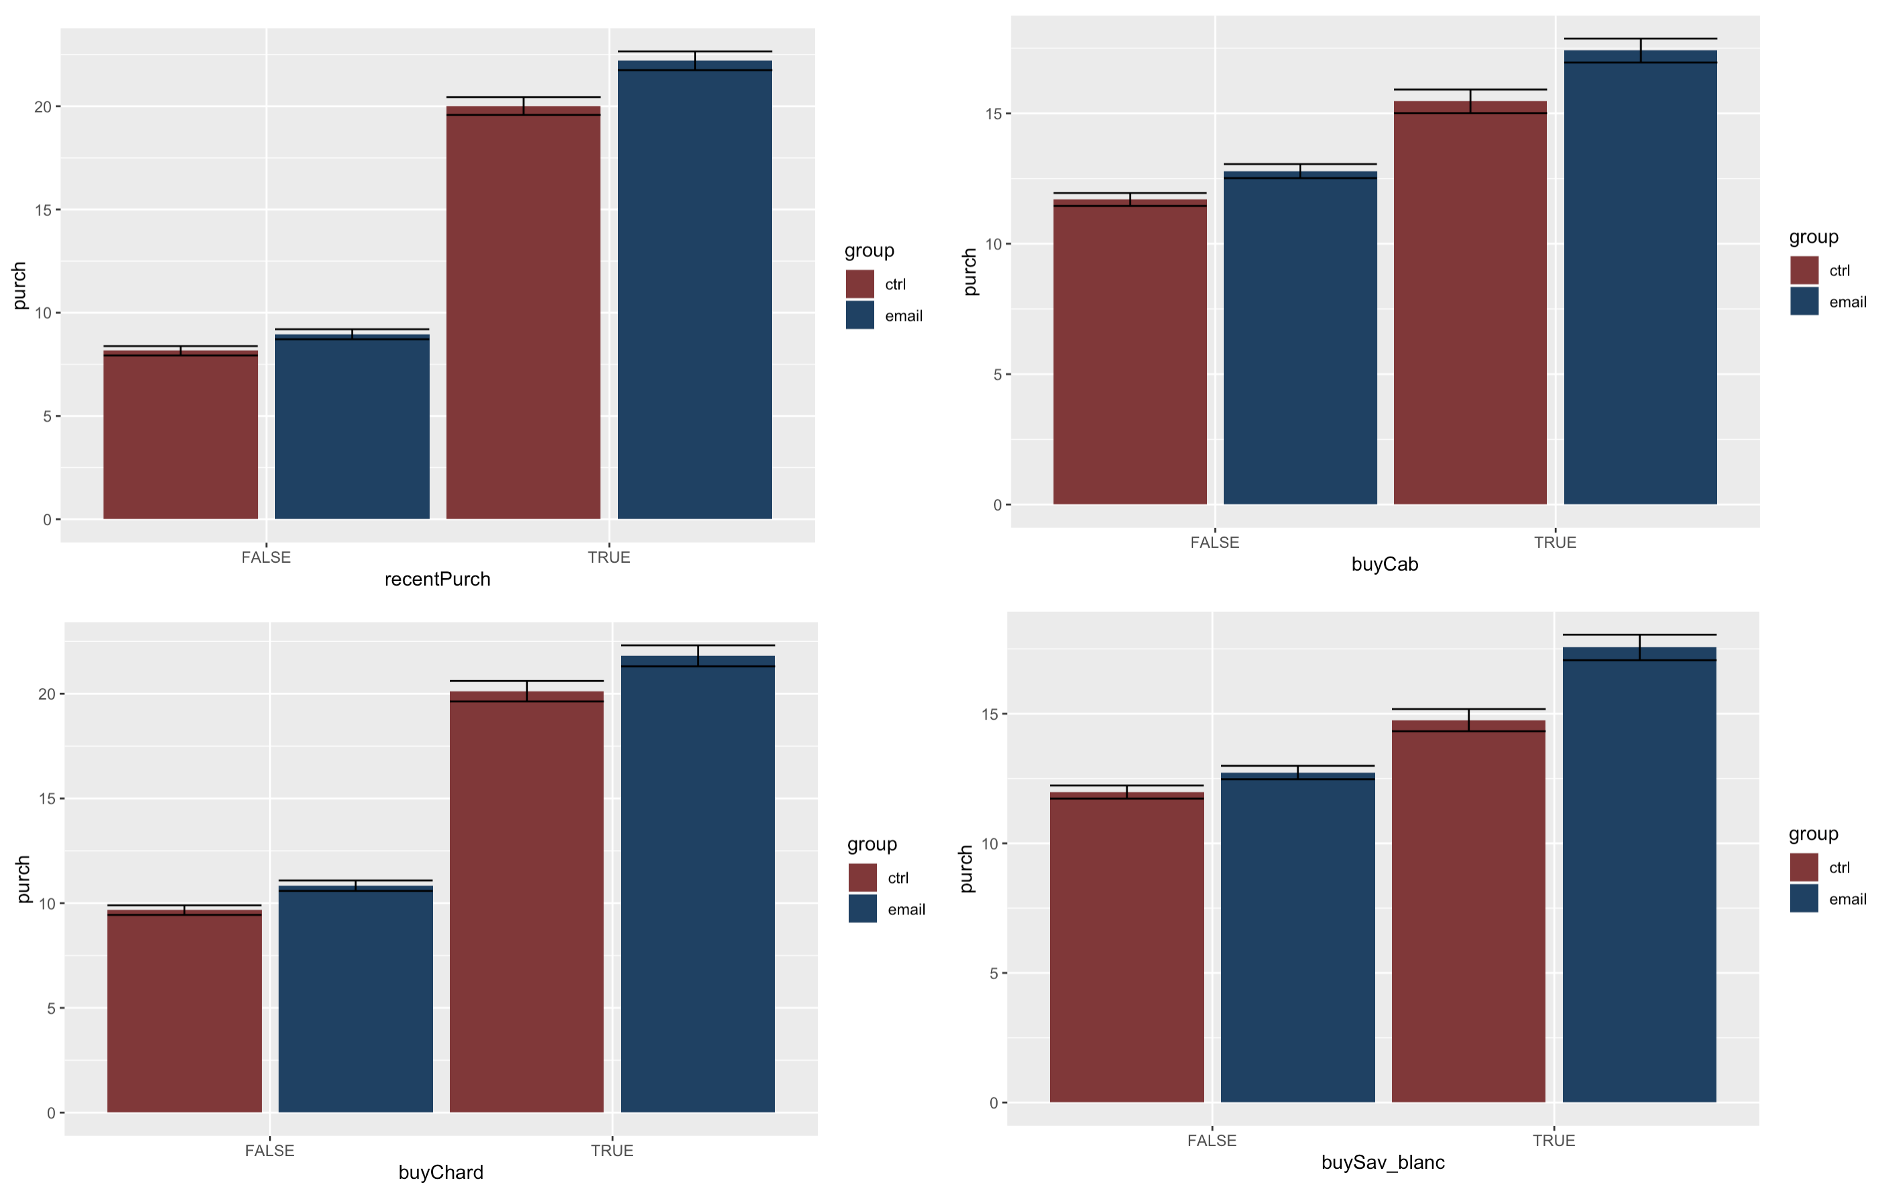
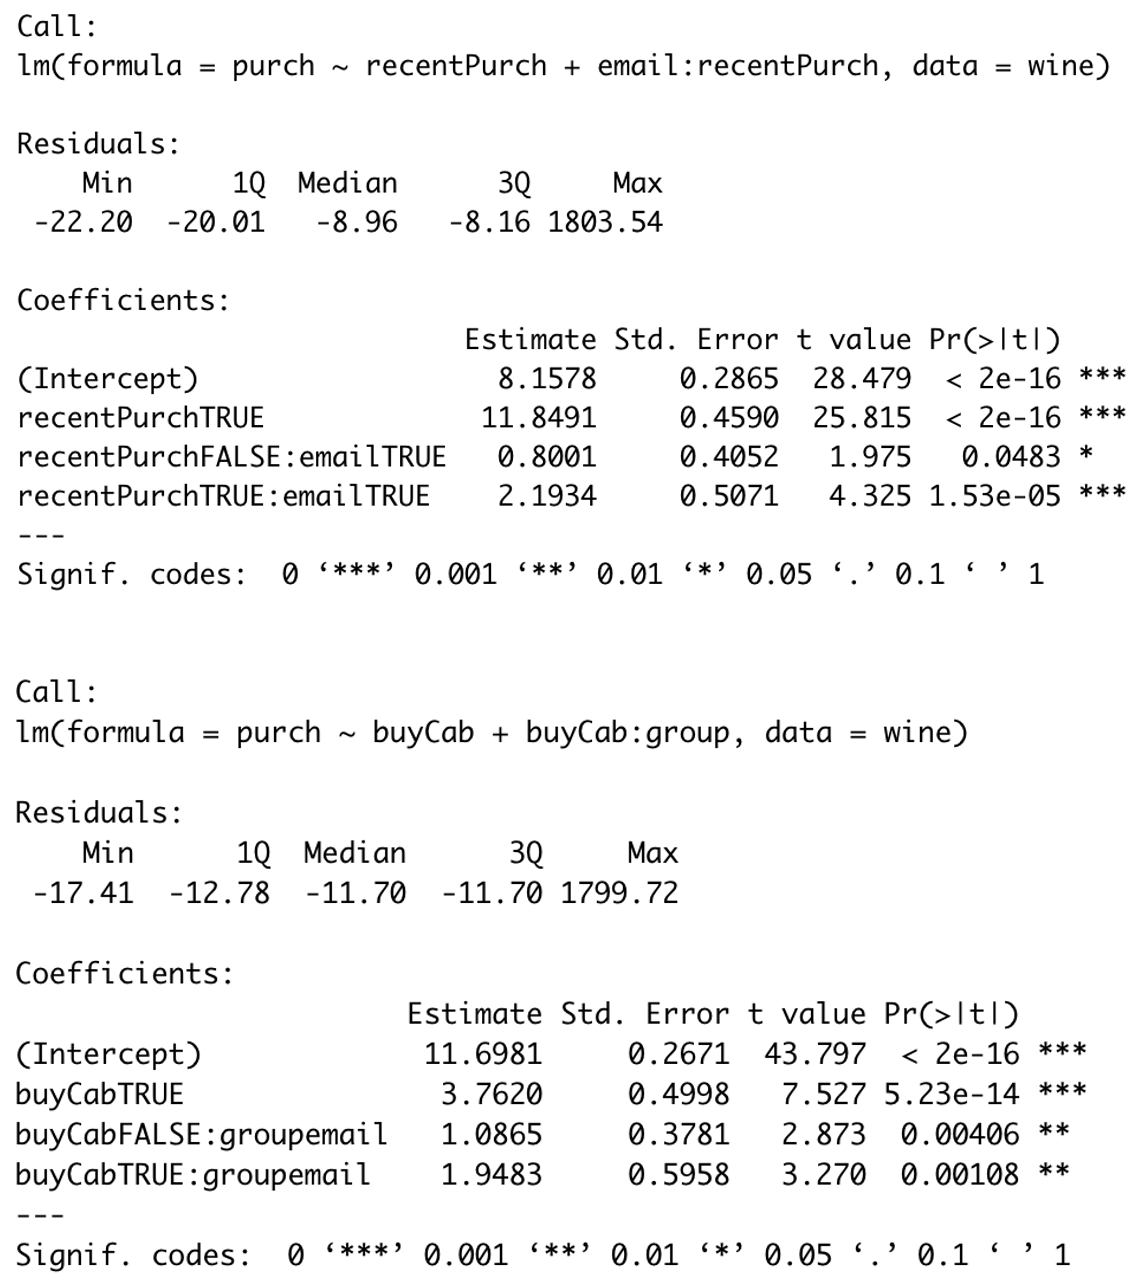
From the plots we can see, sending emails to customers who recently purchased, or customers who bought Chard, Sav_blanc as well as Cab will increase their purchasing amount more compared to the customer in the opposite groups. And the relationships also showed statistical significance through regression.
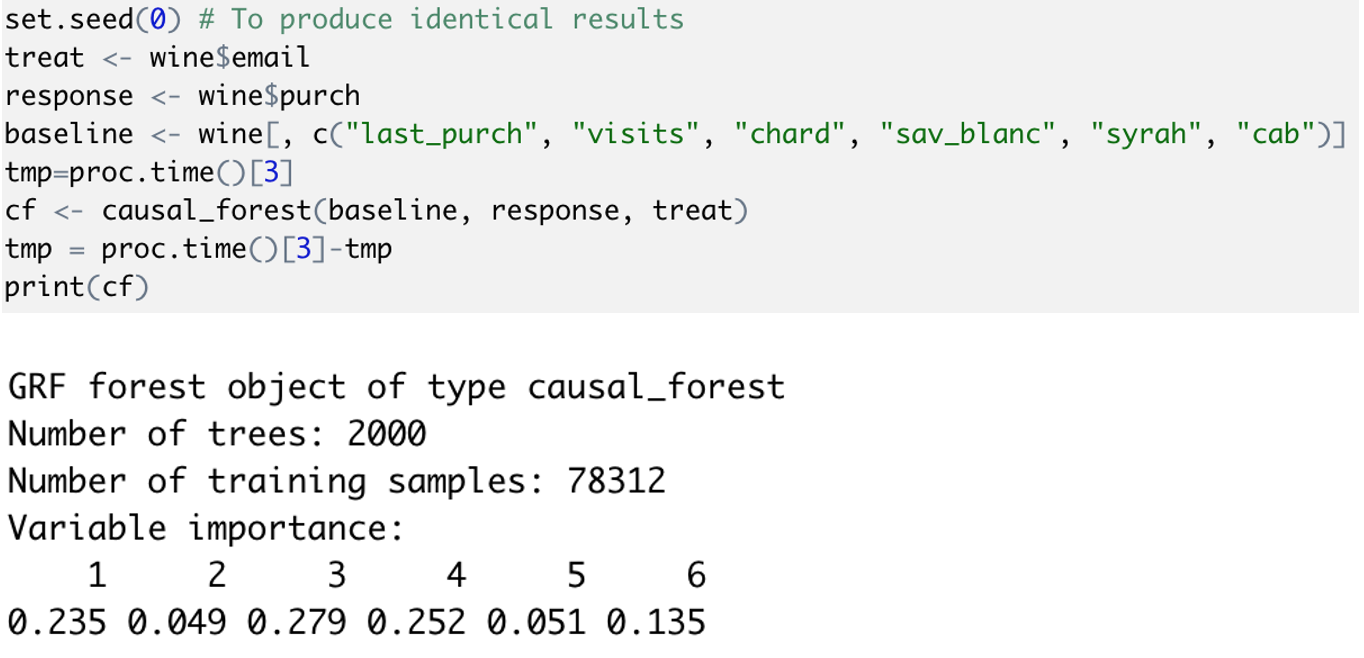
To verify the importance of the four variables we picked, I trained a causal forest model in R which reports the importance of different features. The result matches our conclusion.
Step 3: Determine the Target Group From the Individual Level
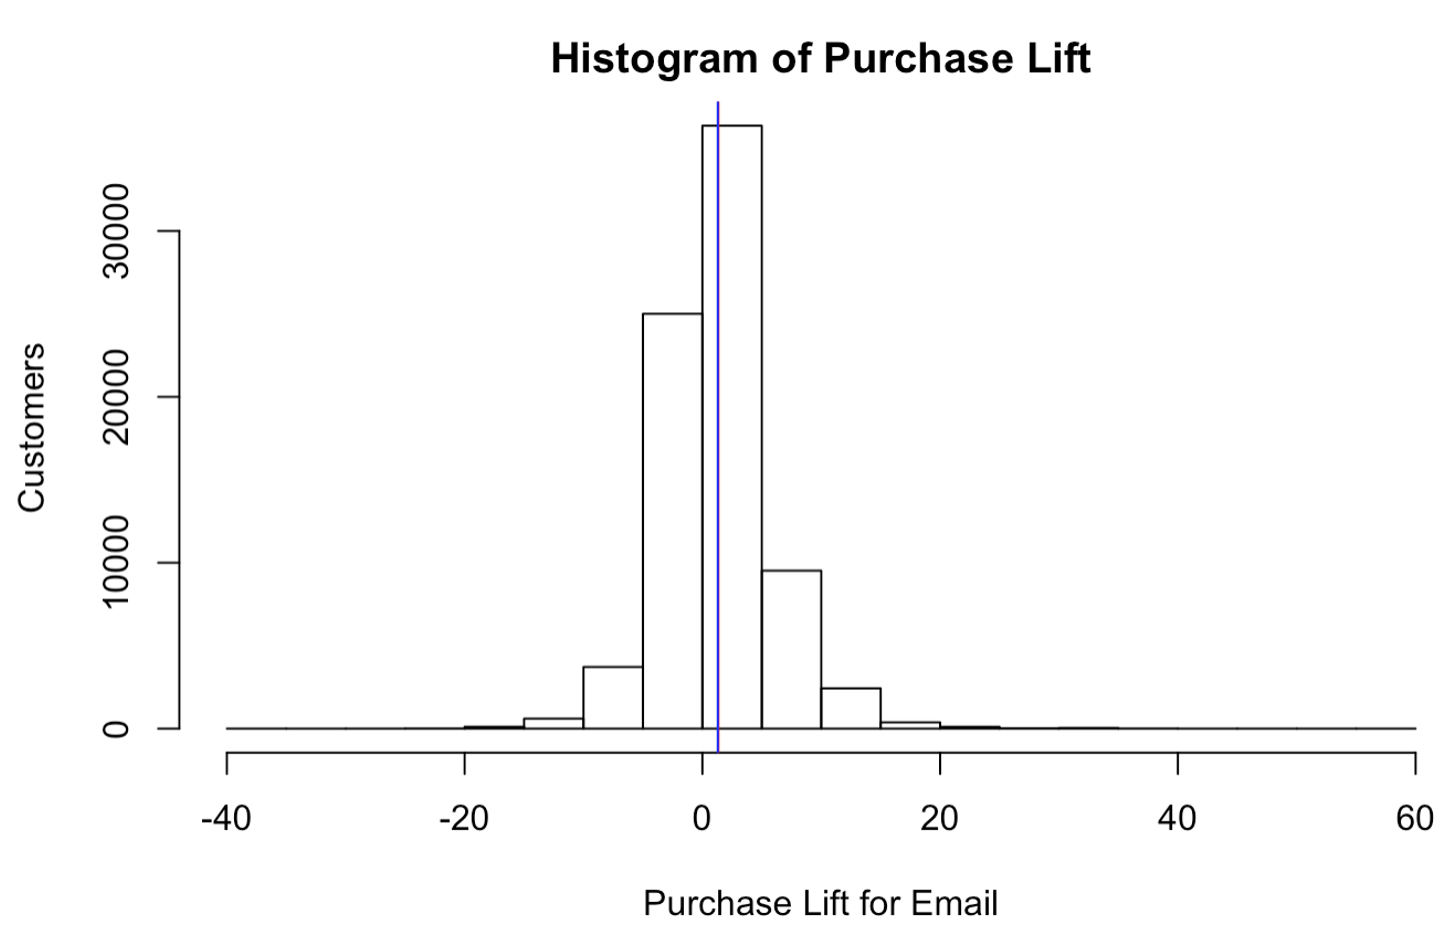
In the last step, we trained a causal forest model to learn the effect of sending emails on the individual level, so here I further used this model to predict the purchase lift for each customer which will help us decide whether we should send emails to them.
Here is a distribution of estimated purchase lift for each customer in our dataset, then considering the average cost of sending an email is approximately 10 cents while the margin of each product is 30%, I calculated the increased profit of each customer and decided those bringing positive profit as our target.
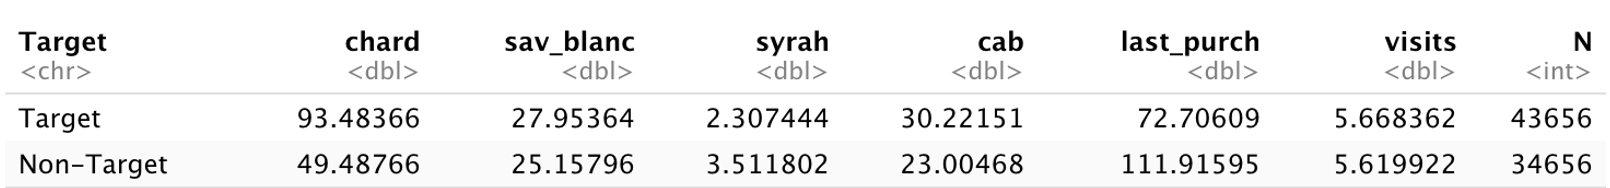
Finally, there are about 56% of customers in the target group, and when looking at the average values for each group, we can easily identify the difference between them, which also verifies the findings in step2.