EarlyRiders Toy Horse Segmentation and Market Simulation Analysis
EarlyRiders is a small toy company that specializes in the manufacture of quality toy riding horses with a particular focus on natural materials. This company had a recent management change and realized that their product set was underperforming. They currently offer two products and one, in particular, was not doing well. The management team decided after much deliberation to revitalize their product portfolio based on the opinions of potential end-users. For this purpose, the company ran a conjoint analysis, and the goal was to analyze the conjoint data and provide product line adjustment recommendations to the management team.
Exploratory Data Analysis
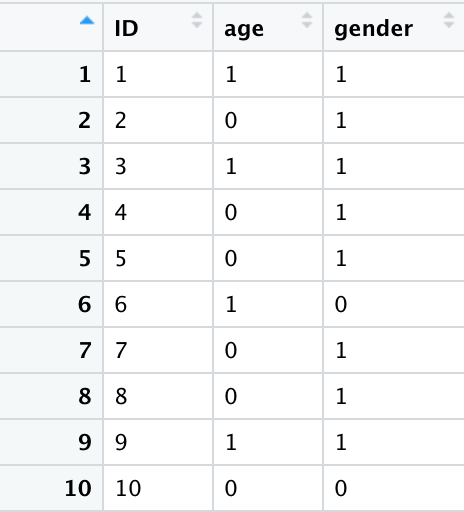
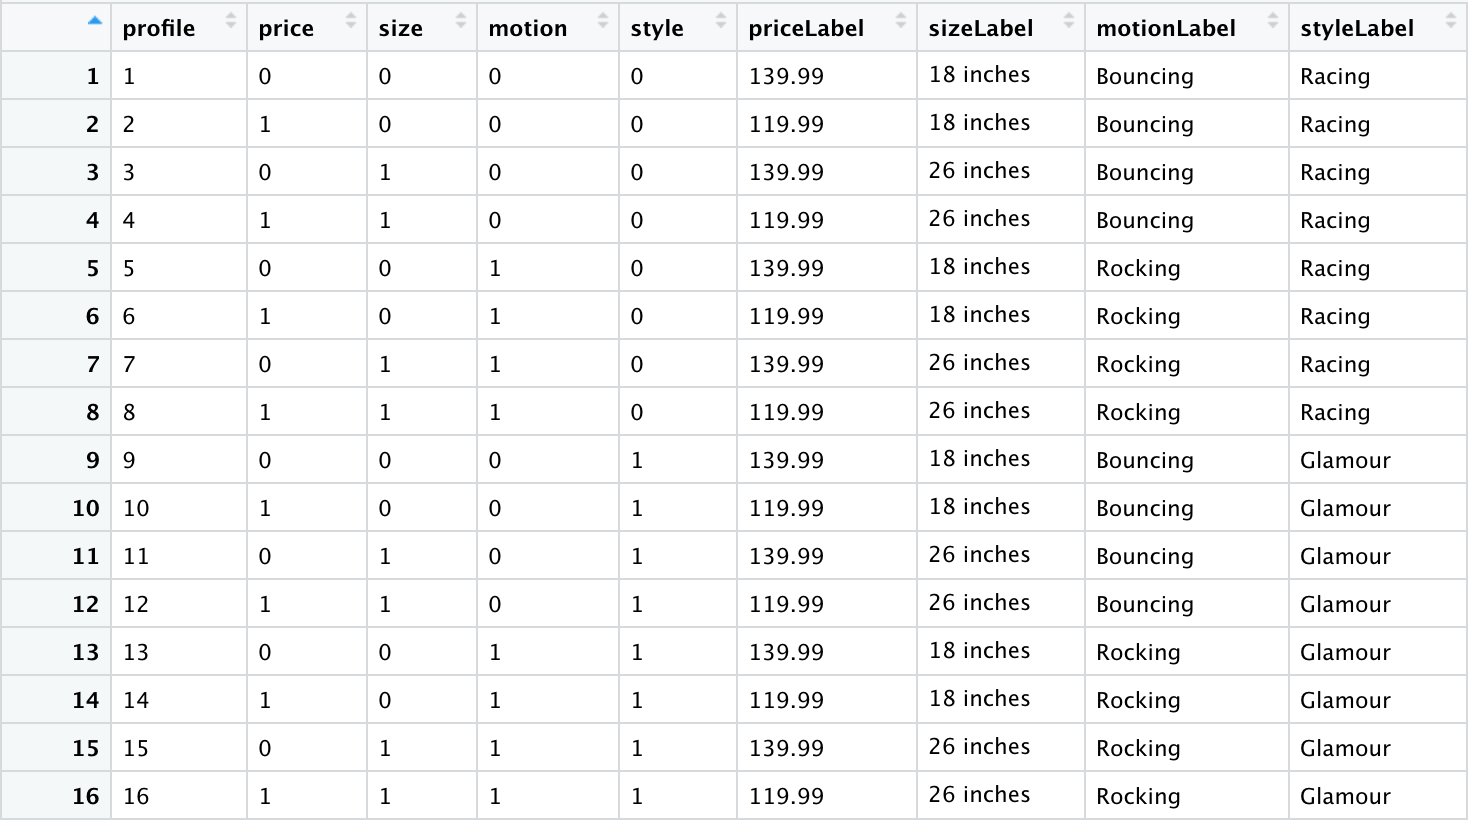
EarlyRiders commissioned a conjoint study of parents of 2-4-year-old kids who planned to purchase a toy horse. In the study, each parent had only one child in the desired age range. Each kid-parent pair was brought into a play location and given the opportunity to ride different prototype horses. The demographic information of each kid is listed below (Gender = 0 if Male, 1 if Female; Age = 0 if 2 years old, 1 if 3-4 years old).
After the kids played on the different horses for 30 minutes, the parents were asked to complete a short conjoint rating study conducted via paper and pencil. Each parent rated a total of 12 profiles. Those profiles vary in four attributes: price, height, motion, and style. The levels for the retail price are $119.99 and $139.99, for height are 18" and 26", for motion are rocking and bouncing, and for style are glamorous and racing.
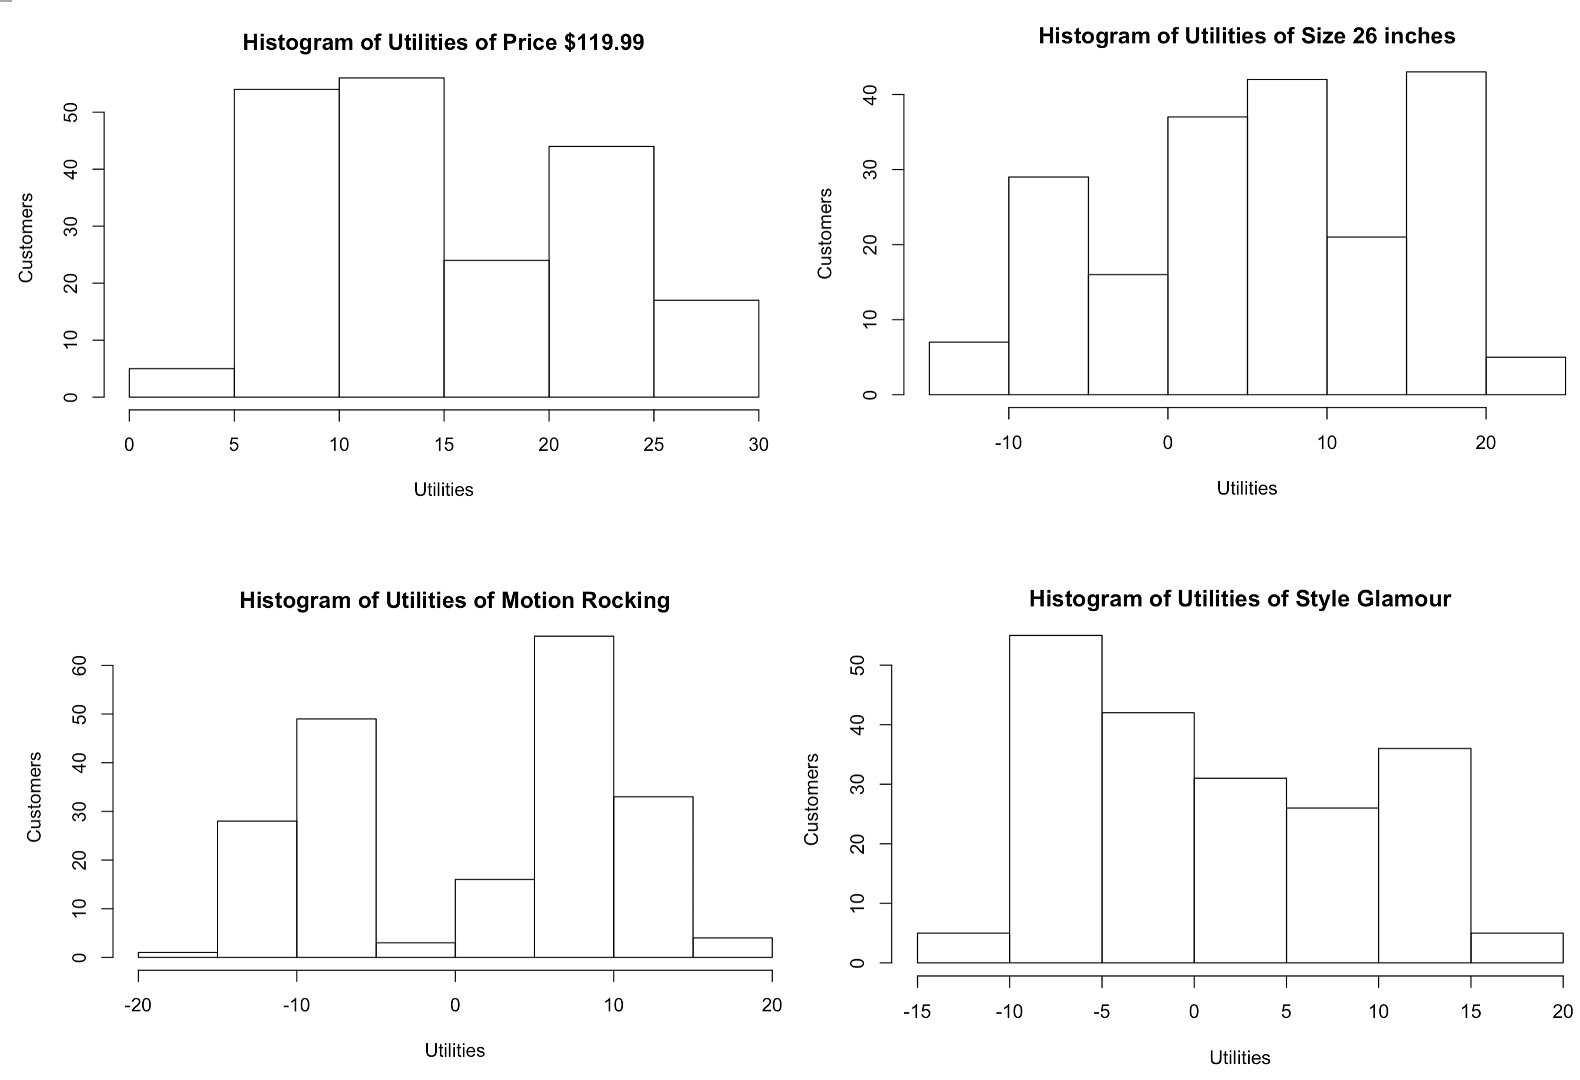
They were told to get their children’s input as if they were going to make this purchase for their children. Because I only had their ratings for 12 profiles, I predicted their ratings for the missing profiles using the individual part utilities calculated by linear regression based on the existing ratings.
The figures showed the utilities of different attributes for each parent. From these figures, I had a general idea: Most people prefer lower prices ($119.99) and larger sizes (26 inches), but their preferences vary in Motion and Style.
Segmentation Analysis
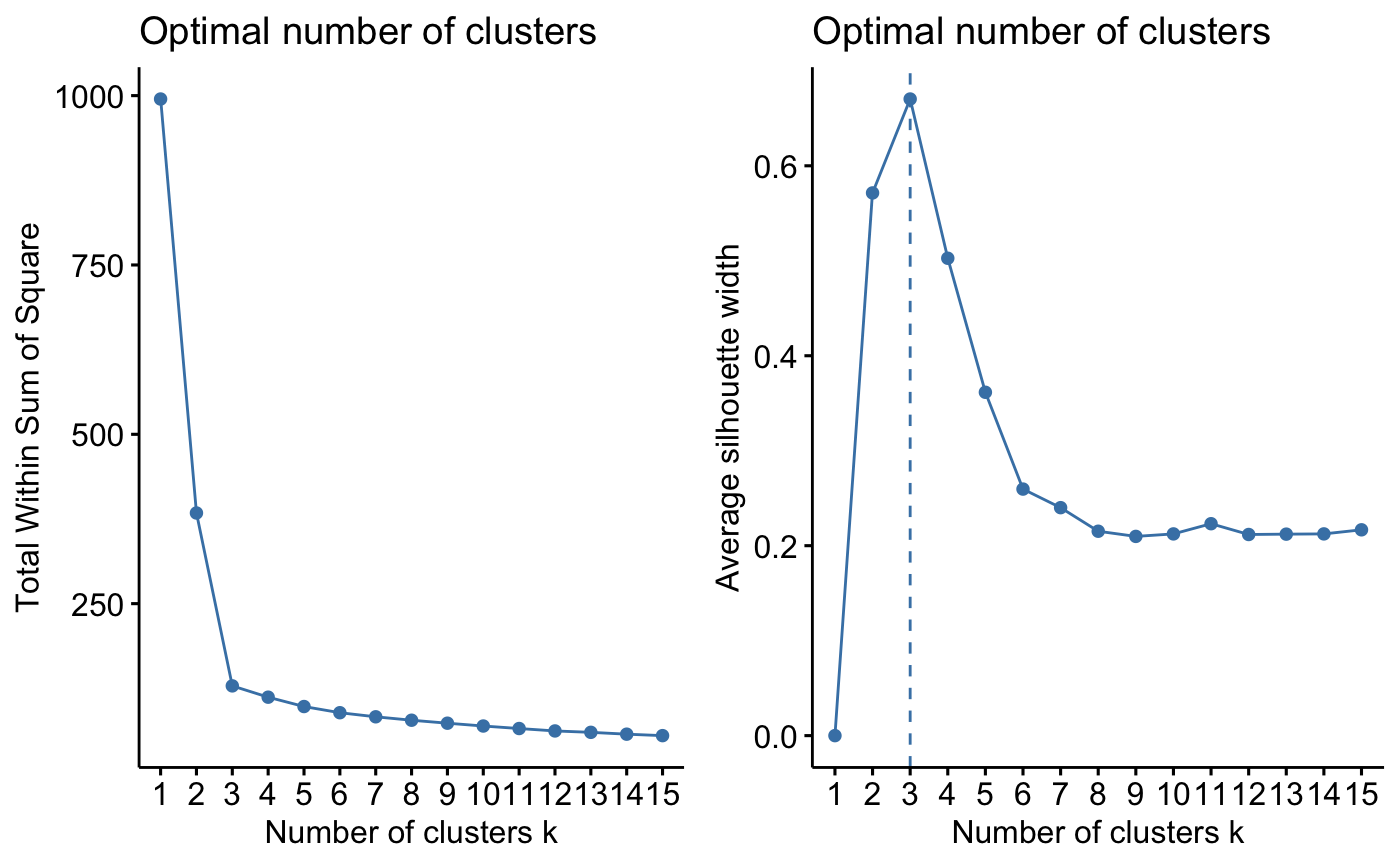
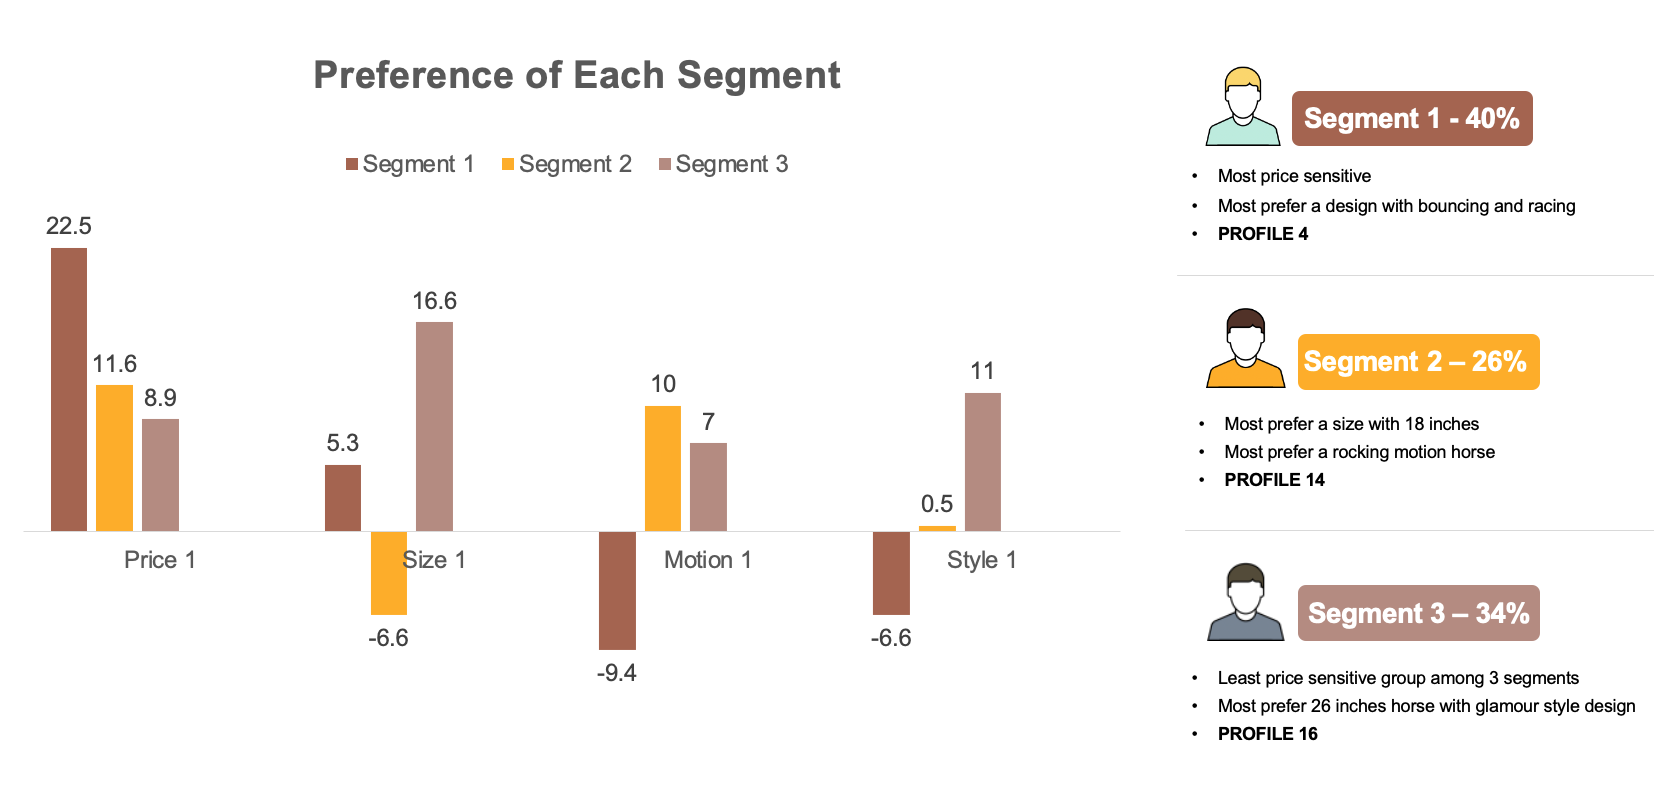
Next, I conducted a segmentation analysis to provide insights for redesigning the product line for the company. First of all, since I had the information about individual-level part utilities, I used clustering analysis to determine the segments. According to the Elbow Rule and Silhouette Rule, I decided to choose three clusters. The cluster plots against Principle Components also verified my choice.
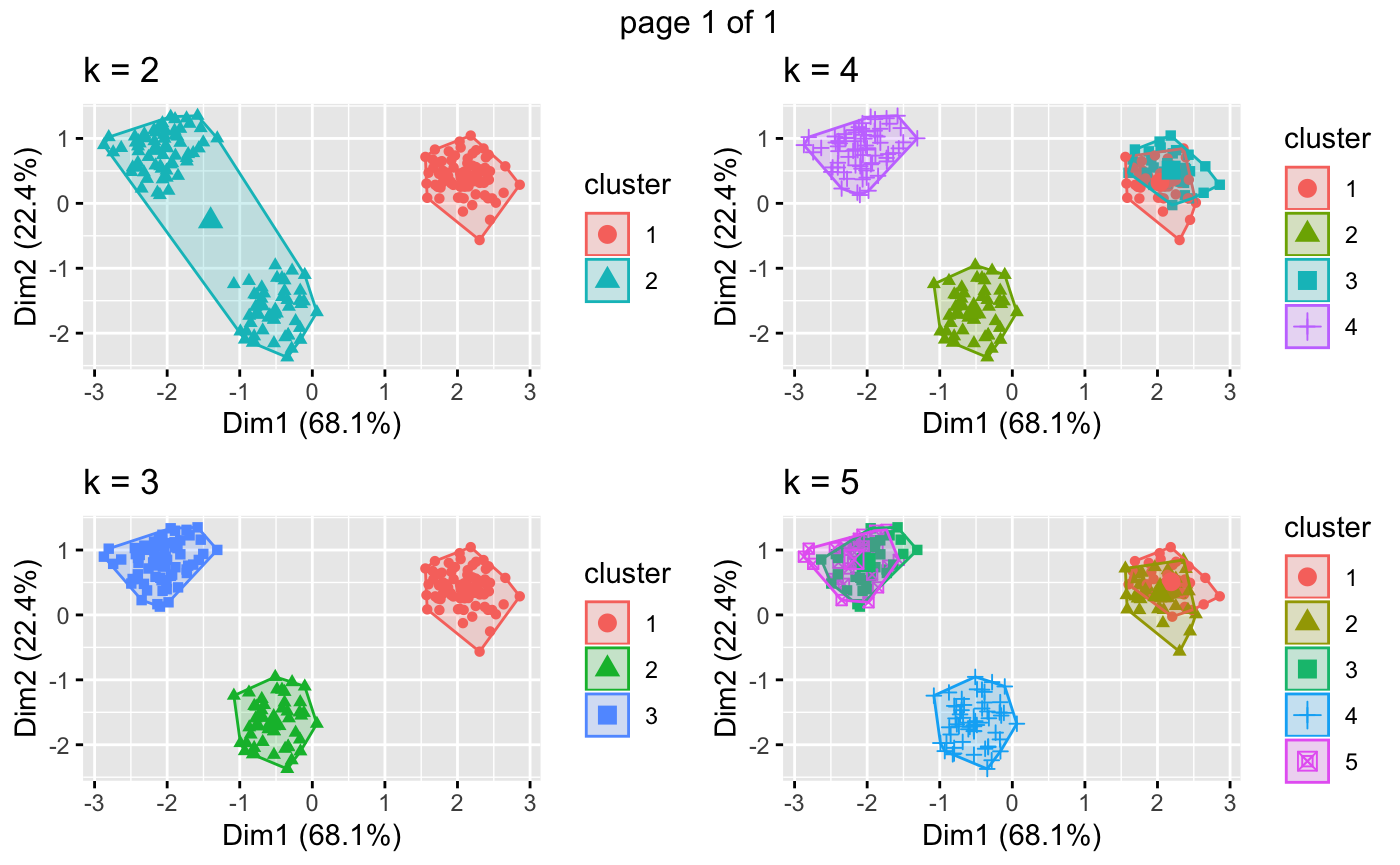
Those three segments of customers take up 40%, 34%, and 26%, and their preferences vary a lot in different attributes. After looking at the attributes of product profiles, I decided to target those segments with PROFILE 4, 14, and 16.
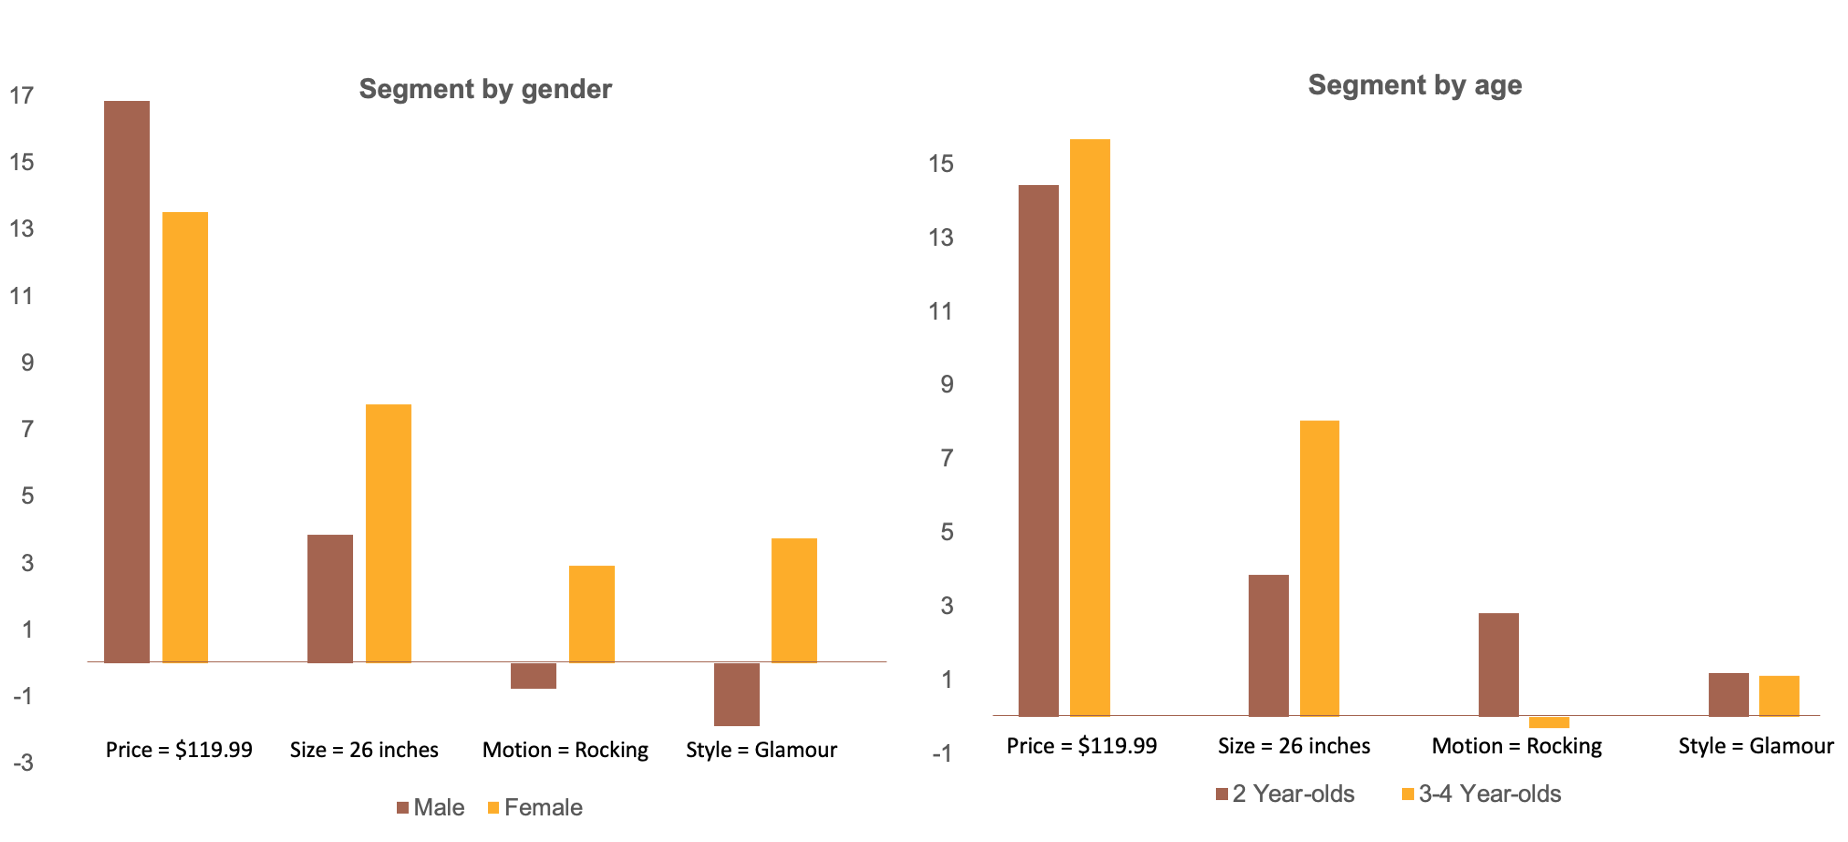
Then I took the children’s age and gender into consideration and segmented them into different groups based on their demographic information. From the results, we can see that all four groups show high utilities for a lower price and larger size, while boys and girls have an opposite preference for motion and style, and 2 year-olds and 3-4 year-olds have an opposite preference for motion. According to this, I decided to target those four groups with PROFILE 4, 12, and 16.
Market Simulations
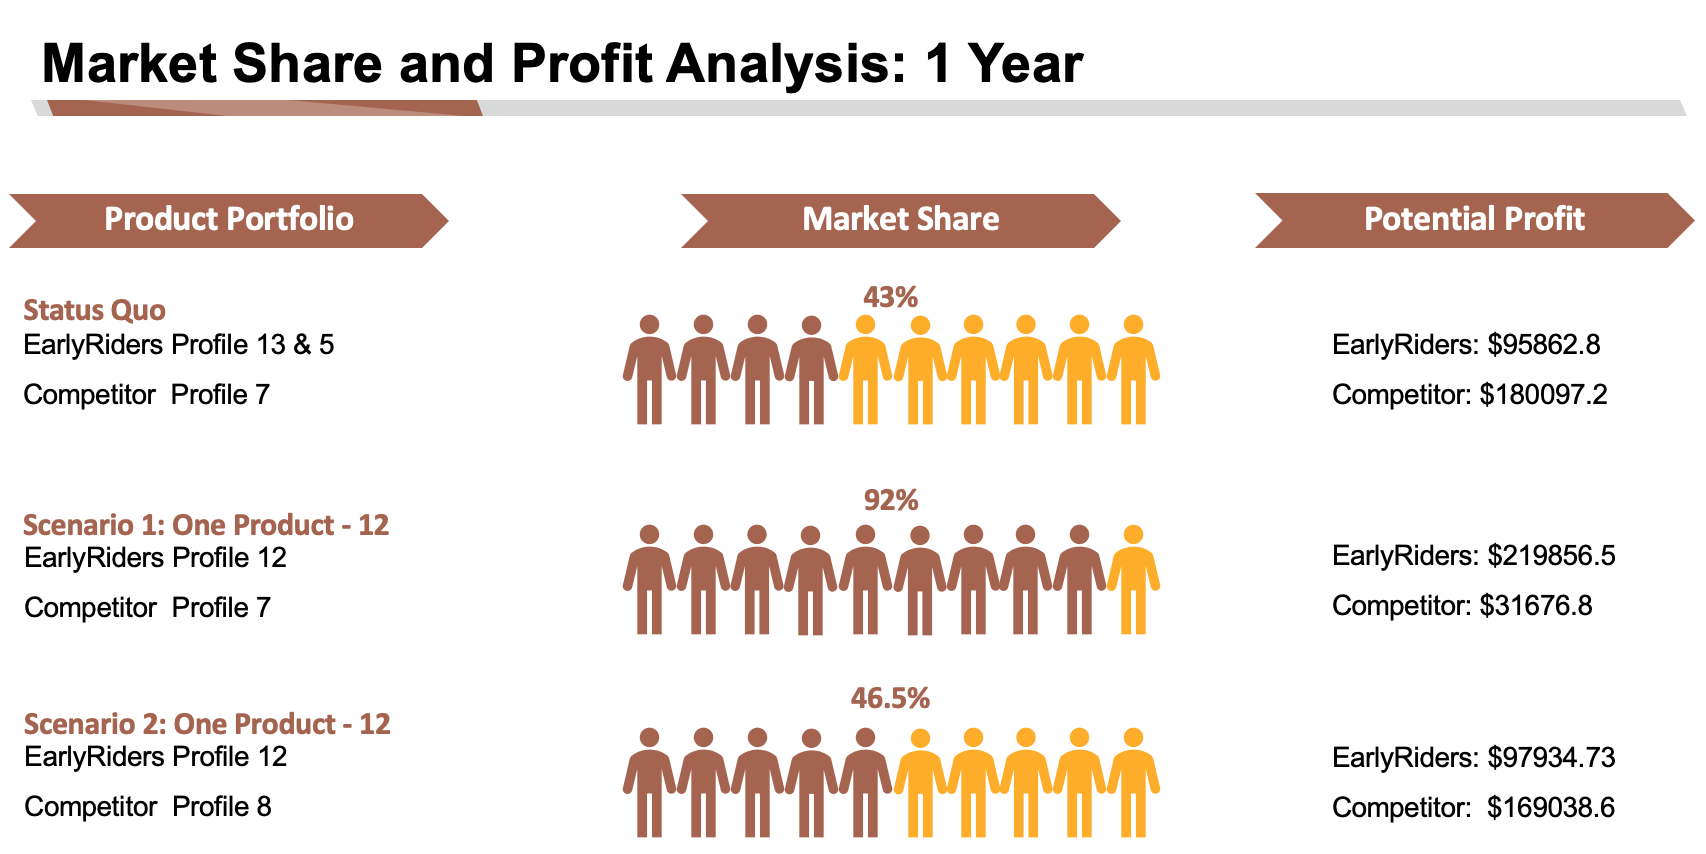
Since I have finished the segmentation and determined the potential four profiles used to target three main segments, now I need to consider more complex problems. How should I decide the combination of product lines since the local retailers can carry at most three models? What would the competitor respond to our adjustments?
To answer these questions, I first estimated the response of our competitors. With the assumption that the competitor’s costs are the same as ours and they will quickly respond to our reaction, I calculated their profit under prices $119.99 and $139.99 (They don’t produce products so they can only change prices) and found that they would certainly decrease their price to gain more profit when we changed our product line.
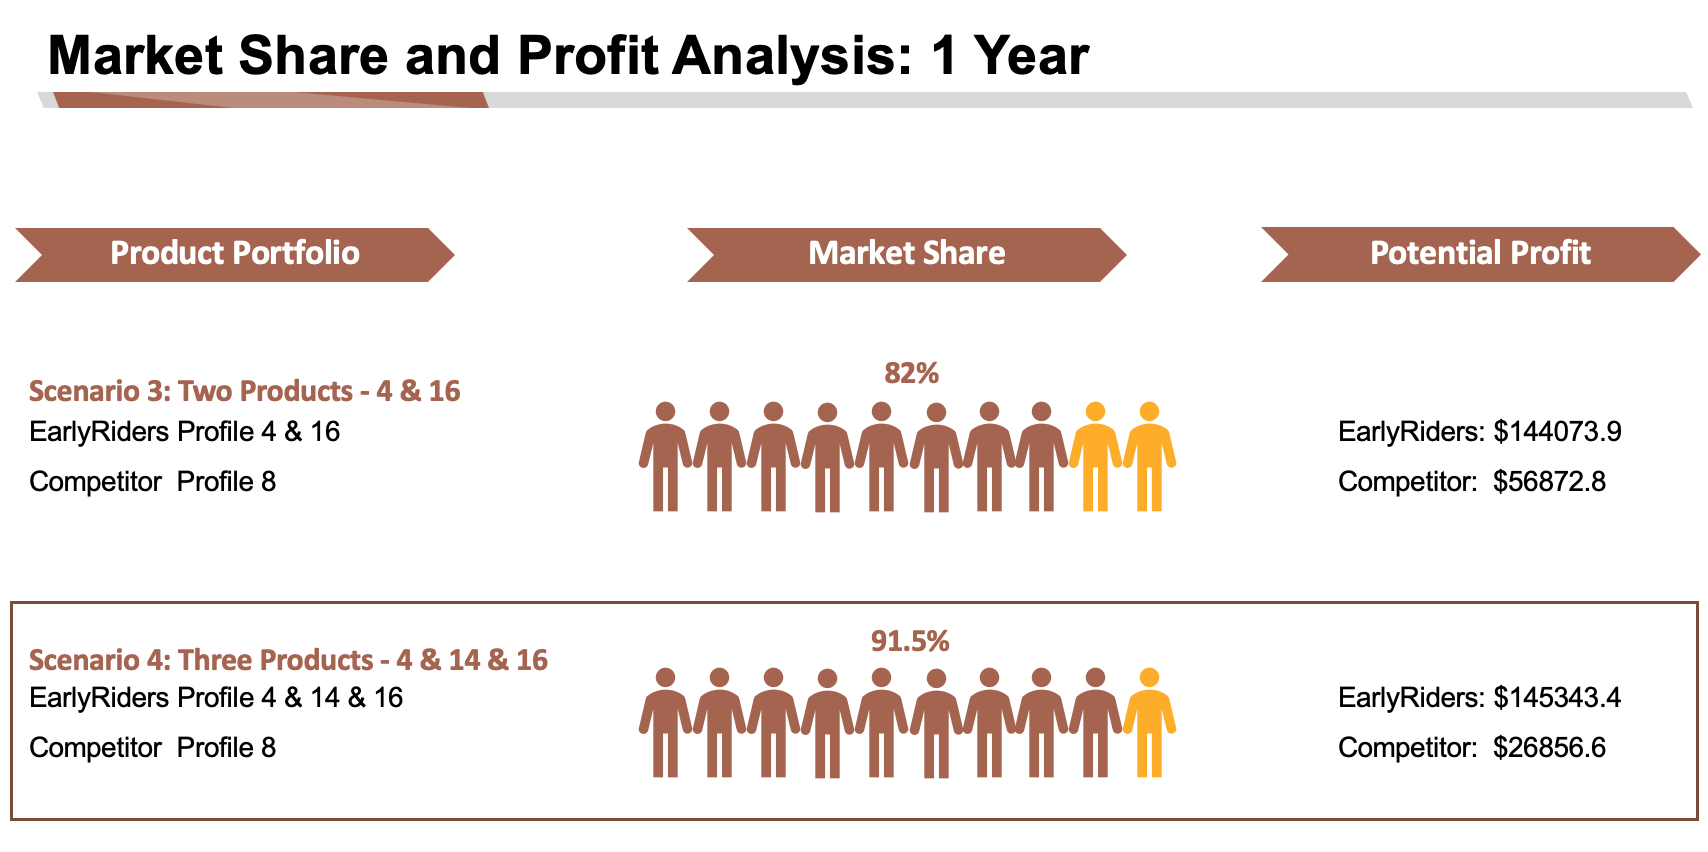
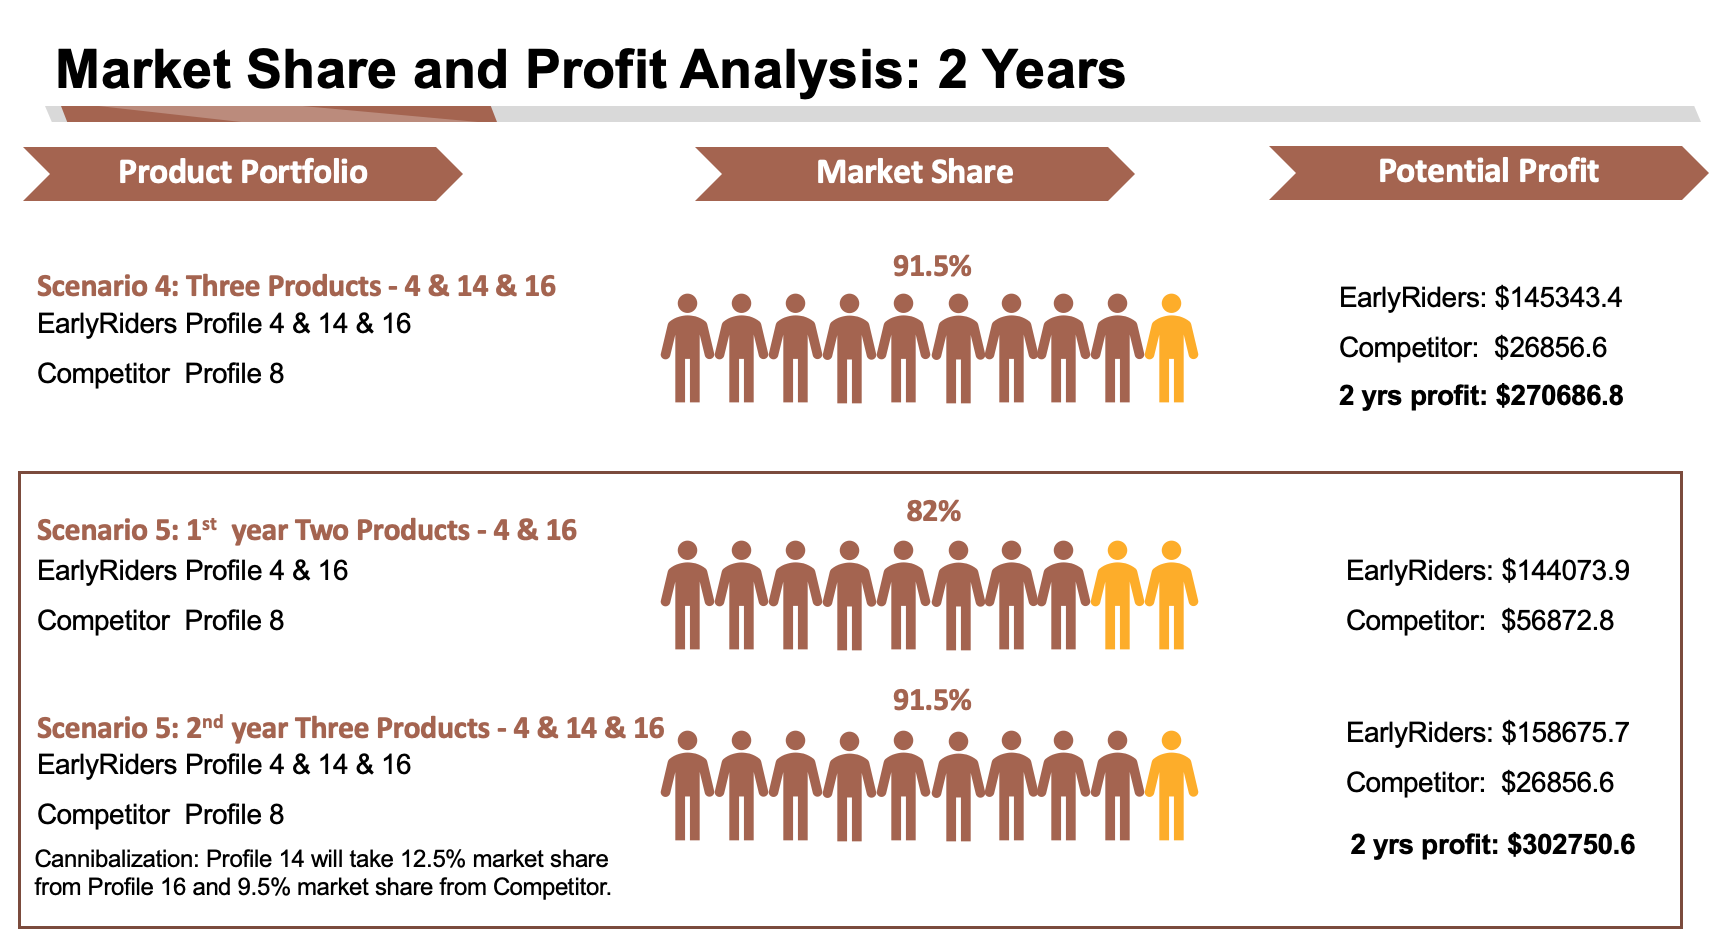
Then I calculated the profit and market share of EarlyRiders with different product lines as well as different launching strategies. The results clearly showed that the company should choose the product line consisting of PROFILE 4, 14, and 16 while launching PROFILE 4 and 16 in the first year and 14 in the second year so they can maximize the market share and minimize the fixed cost at the same time in order to gain the highest profit.